Anthropic Just Made IPO History. The Smart Money Bought the Toll Booths.
By Chris Rowe ·
This morning, Anthropic (ANT), the company behind the Claude chatbot, made its Nasdaq debut.
It raised $81.3 billion, the largest IPO on record. That tops SpaceX's $75 billion offering in June.
It priced at $83 a share, above its initial range of $70 to $78. That values the company at about $1.5 trillion.
Should you buy the hottest AI stock of the year?
Good question…
But our "True Market" indicators have been pointing at a different trade for weeks. The businesses that get paid no matter which stock wins.
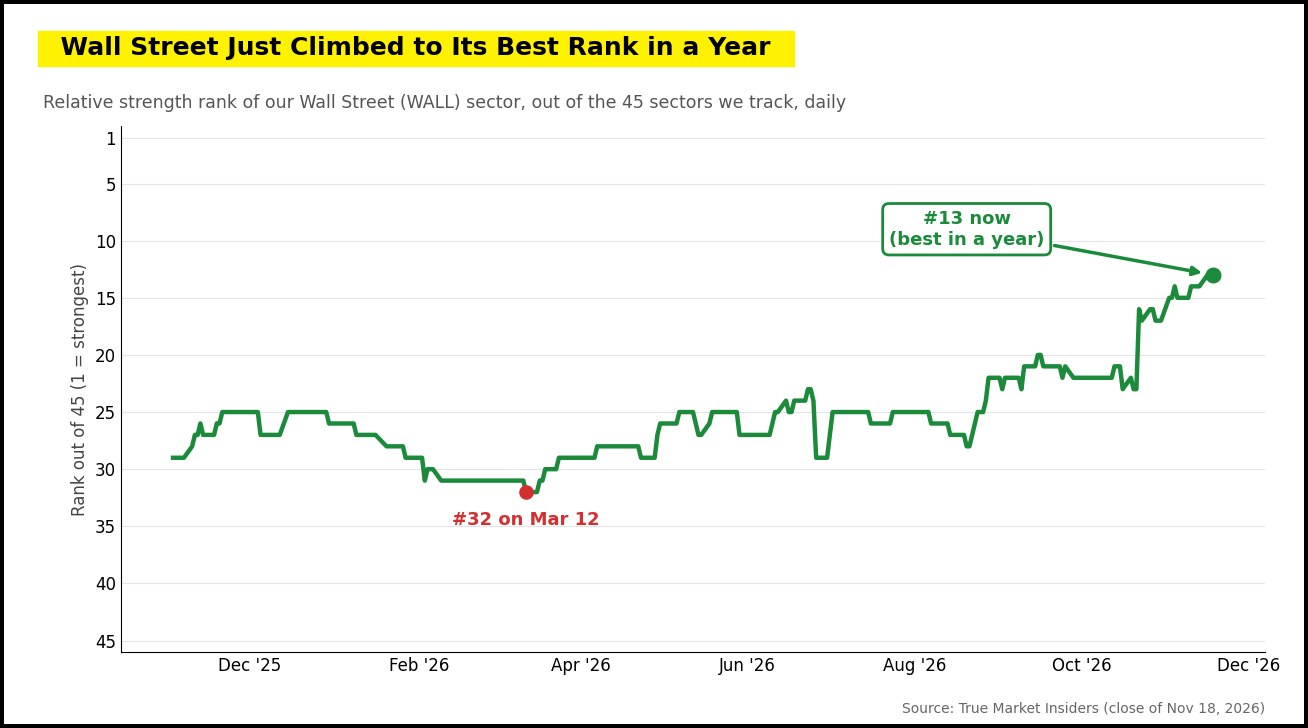
As of Wednesday's close, Wall Street (WALL), which houses 139 stocks, from brokers and exchanges to asset managers, ranks #13 out of the 45 sectors we track, ranked by relative strength.
That's its best rank in a year. Back on March 12th, it was #32. On October 21st, it was #23.
Who Collects on Every Trade?
Anthropic's pricing filing shows the underwriters bought the shares at $82.44 and sold them at $83.
That's about $550 million, split between lead managers Goldman Sachs (GS) and Morgan Stanley (MS) and 20 other banks.
You'd think their stocks would be on fire. They're not.
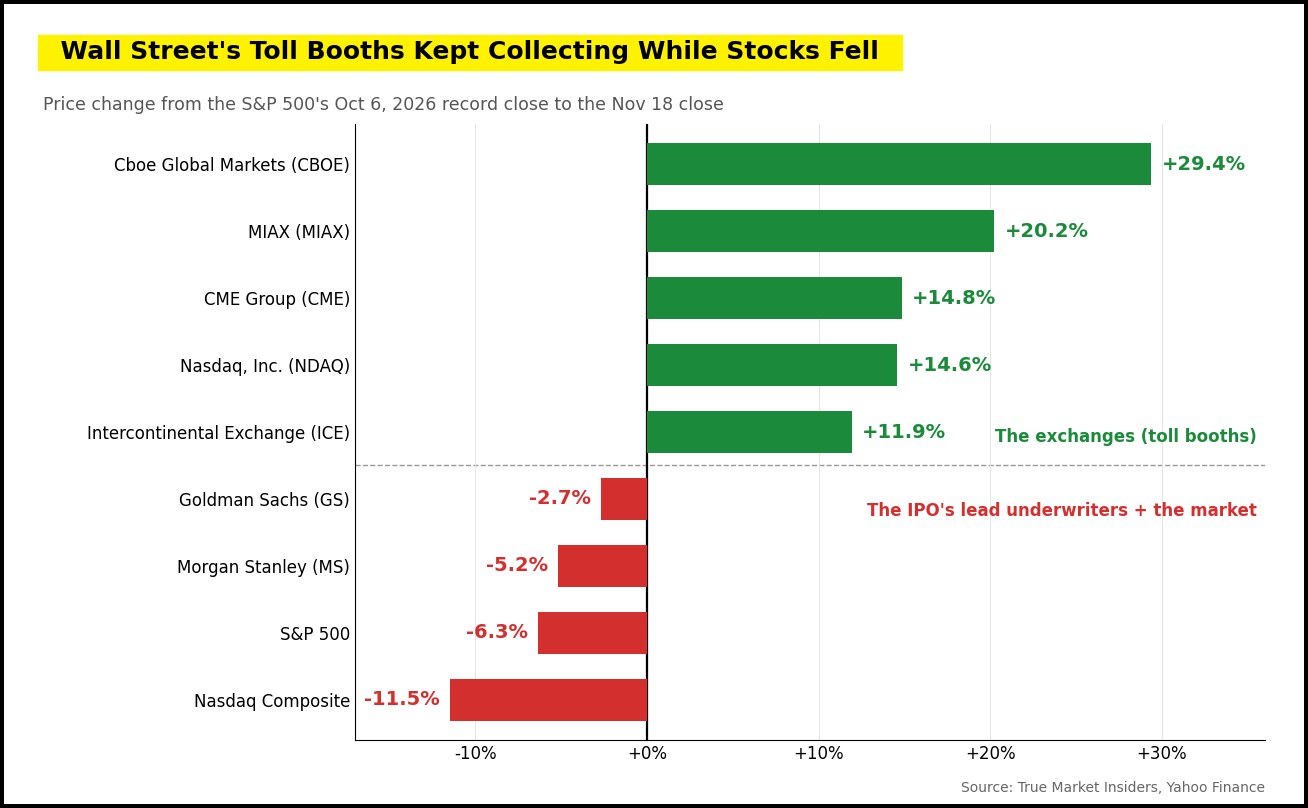
Since the S&P 500's October 6th record close, Goldman is down 2.7% and Morgan Stanley is down 5.2% (the S&P 500 fell 6.3% over the same period).
So where did the big money go instead?…
Follow the Toll Booths
The exchanges went the other way.
Cboe Global Markets (CBOE) is up +29.4%. MIAX (MIAX) is up +20.2%. CME Group (CME) is up +14.8%. Nasdaq, Inc. (NDAQ), which just landed the biggest listing ever, is up +14.6%. And Intercontinental Exchange (ICE), owner of the New York Stock Exchange, is up +11.9%.
Exchanges don't need any one stock to win. They collect a fee on every share and every contract that changes hands.
And when the market gets choppy, more contracts change hands.
What the Wall Street Participation Chart Says
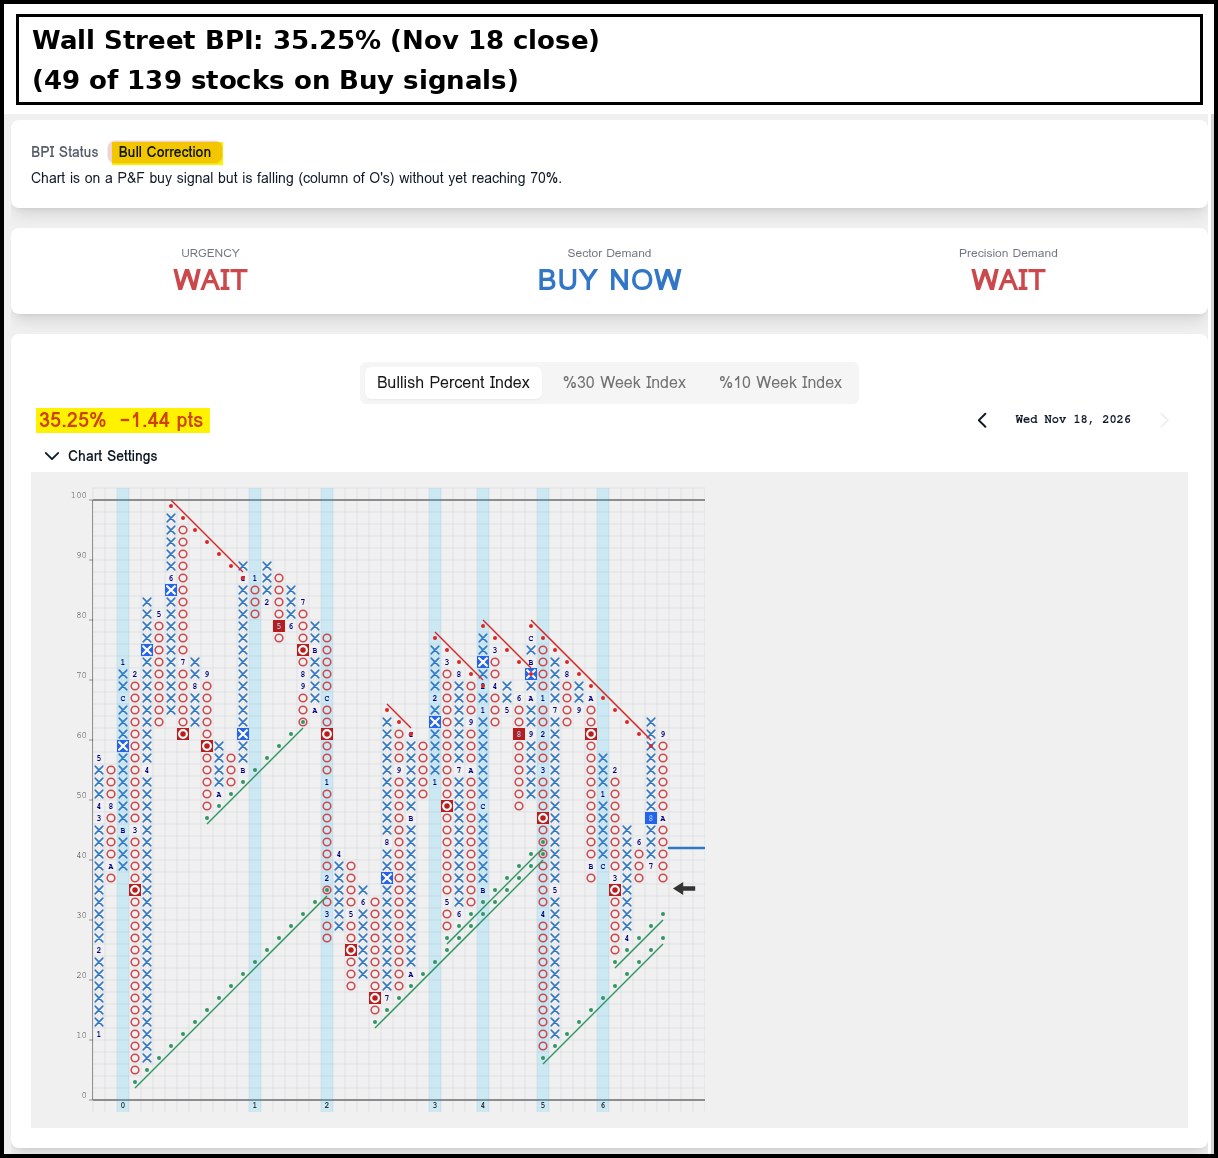
The sector's Bullish Percent Index (BPI) is the percentage of its stocks on bullish Buy signals. That means it's a gauge of how much participation there is in a rally.
It stands at 35.25%. That means 49 of the 139 stocks in the sector are trading on bullish Buy signals.
The chart is still on a Buy signal, but it has been in a column of O's since September 15th. That's Bull Correction, meaning Supply (the bears) controls the short-term trend inside a longer-term uptrend.
In plain English: this is not a rally where every Wall Street stock is getting bought. The median stock in the sector is down 3.7% since October 6th.
The leadership is narrow. And it's concentrated in the exchanges.
Want to see where all 45 sectors rank every day, before the headlines catch up? That's what Sector Prophets Pro members get, plus sector BPI alerts and live mentoring sessions. See how Sector Prophets Pro works.
How I'd Play It
For broad exposure, the iShares U.S. Broker-Dealers & Securities Exchanges ETF (IAI) is a close match.
It holds the big brokers and the exchanges. But Goldman and Morgan Stanley alone make up about a third of the fund. Since October 6th, IAI is down 1.4% (the S&P 500 fell 6.3% over the same period).
So if you're looking for exposure to the toll booths, I'd go stock by stock.
Cboe Global Markets runs stock and options exchanges, and it's the home of the VIX, the market's "fear gauge."
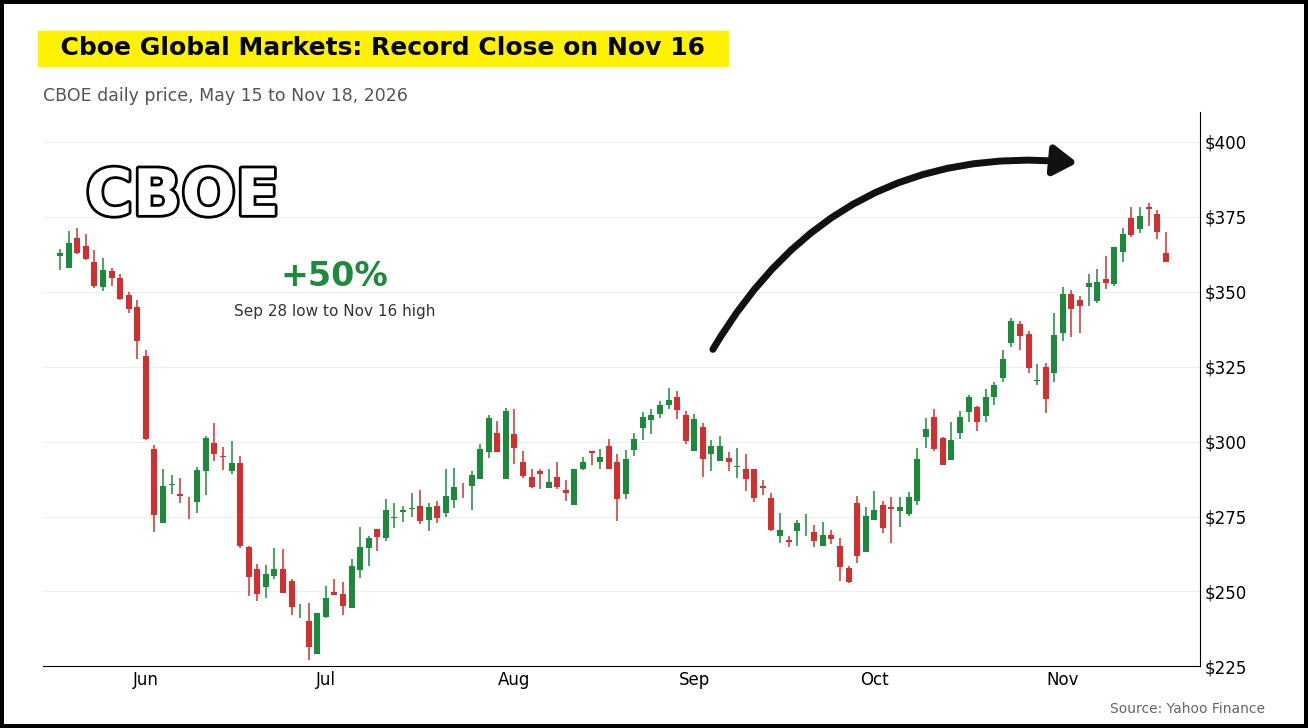
The stock is up +43.4% this year (the S&P 500 is up +7.0% over the same period).
On October 30th, the company reported record third-quarter earnings of $4.08 per share, up 43% from a year earlier. Net revenue rose 18% to $712.2 million.
Index options volume jumped 24%, with record activity in same-day (0DTE) options. And management raised its full-year growth target to the "high teens."
The stock gained +6.8% that day.
The risk: Cboe makes more money when traders are busy. If the market calms down and volume dries up, that tailwind fades. And the stock has pulled back the last two days.
It closed Wednesday at $359.91, 4.7% below its November 16th record close of $377.50.
And I ran a Fibonacci Extension study (not shown) measuring the stock's move from its October 29th intraday low of $309.72 to its November 16th intraday high of $379.76. That study gives me a minimum price objective of approximately $449.80 per share.
From $359.91, a move to $449.80 would represent a potential upside of roughly +25%.
Everyone's watching the biggest IPO ever.
The big money is watching who collects the fees.
Thanks for reading,
Chris Rowe
Sector Edge